
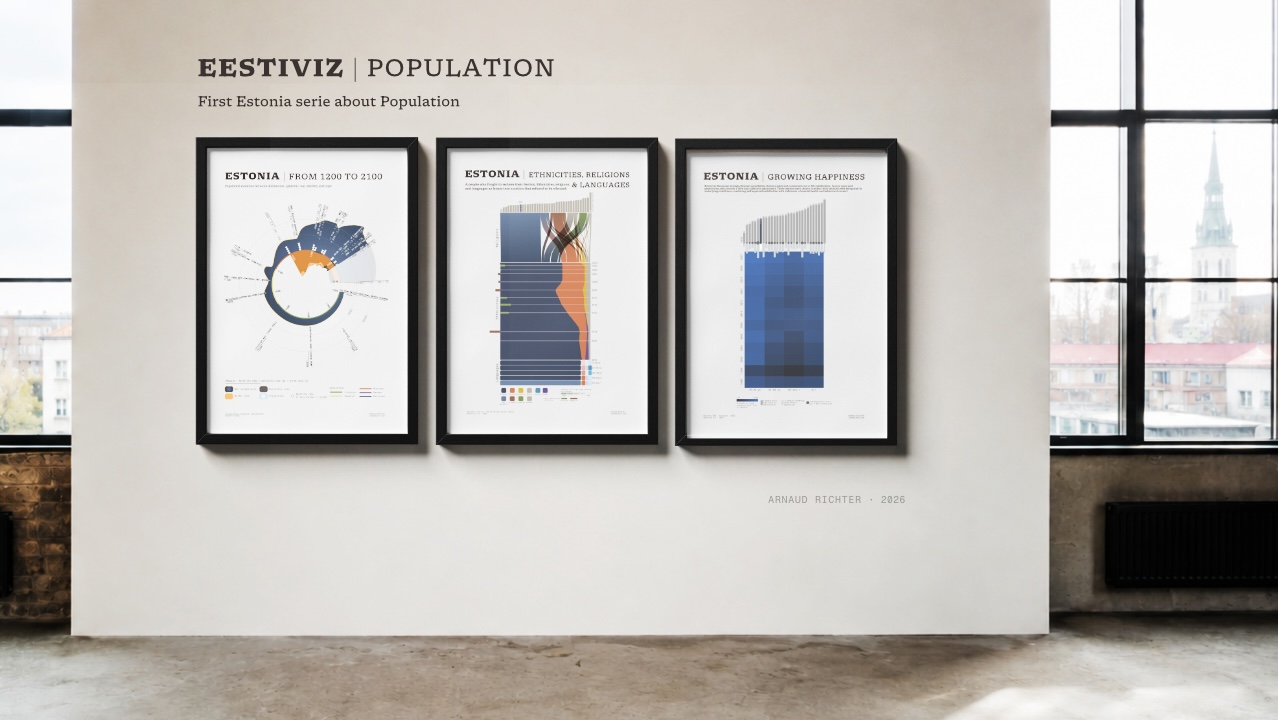
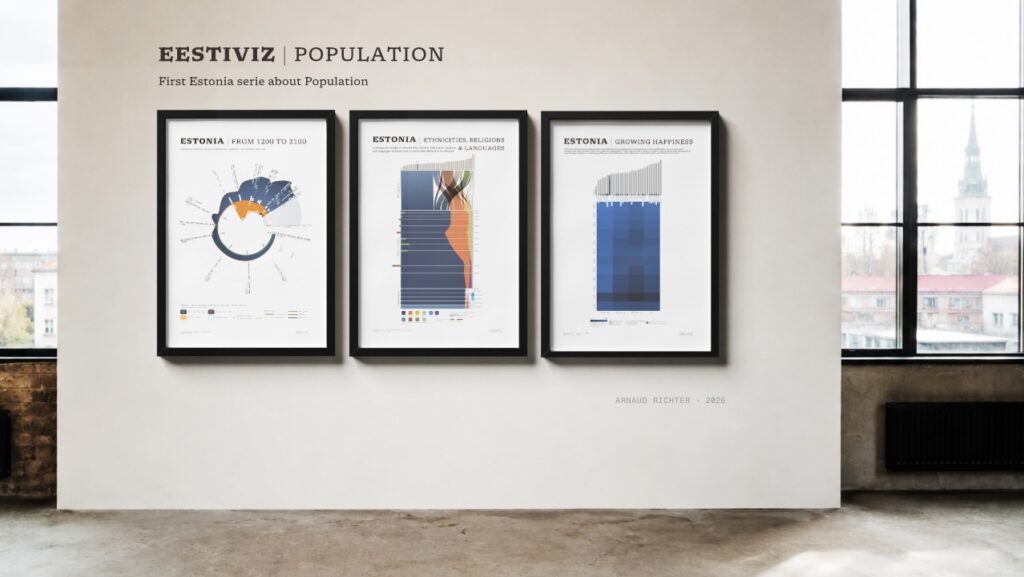
I started the population piece in 2025, and I’ve been building out the rest of the series since. Each piece follows the same principle behind my practice: information that reads as an abstract, minimal pattern from a distance and resolves into precise data up close. I call this technique double reading, and it runs through everything I make.
Why Estonia?
I spent my Erasmus semester in Tallinn in 2005, just over twenty years ago, studying at Tallinn Technology University (TalTech). That’s where I found the country I feel most aligned with : the calm, the landscape, but also the tech scene and a certain restlessness to build things. Dedicating a data art series to Estonia is my way of making this connection stronger and letting people discover or know more about Estonia. This is my first Estonia data art series : population, culture and happiness through history.
How did Estonia’s population change from 1200 to 2100?
This article was a small introduction ; https://silmstudio.com/estonian-population-datavisualization/
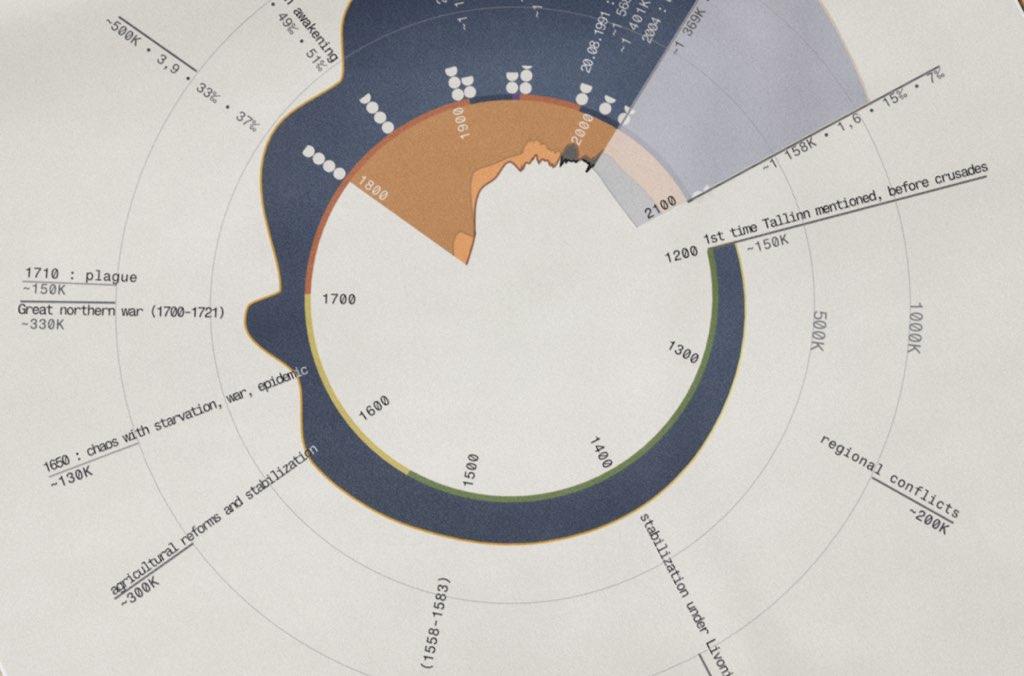
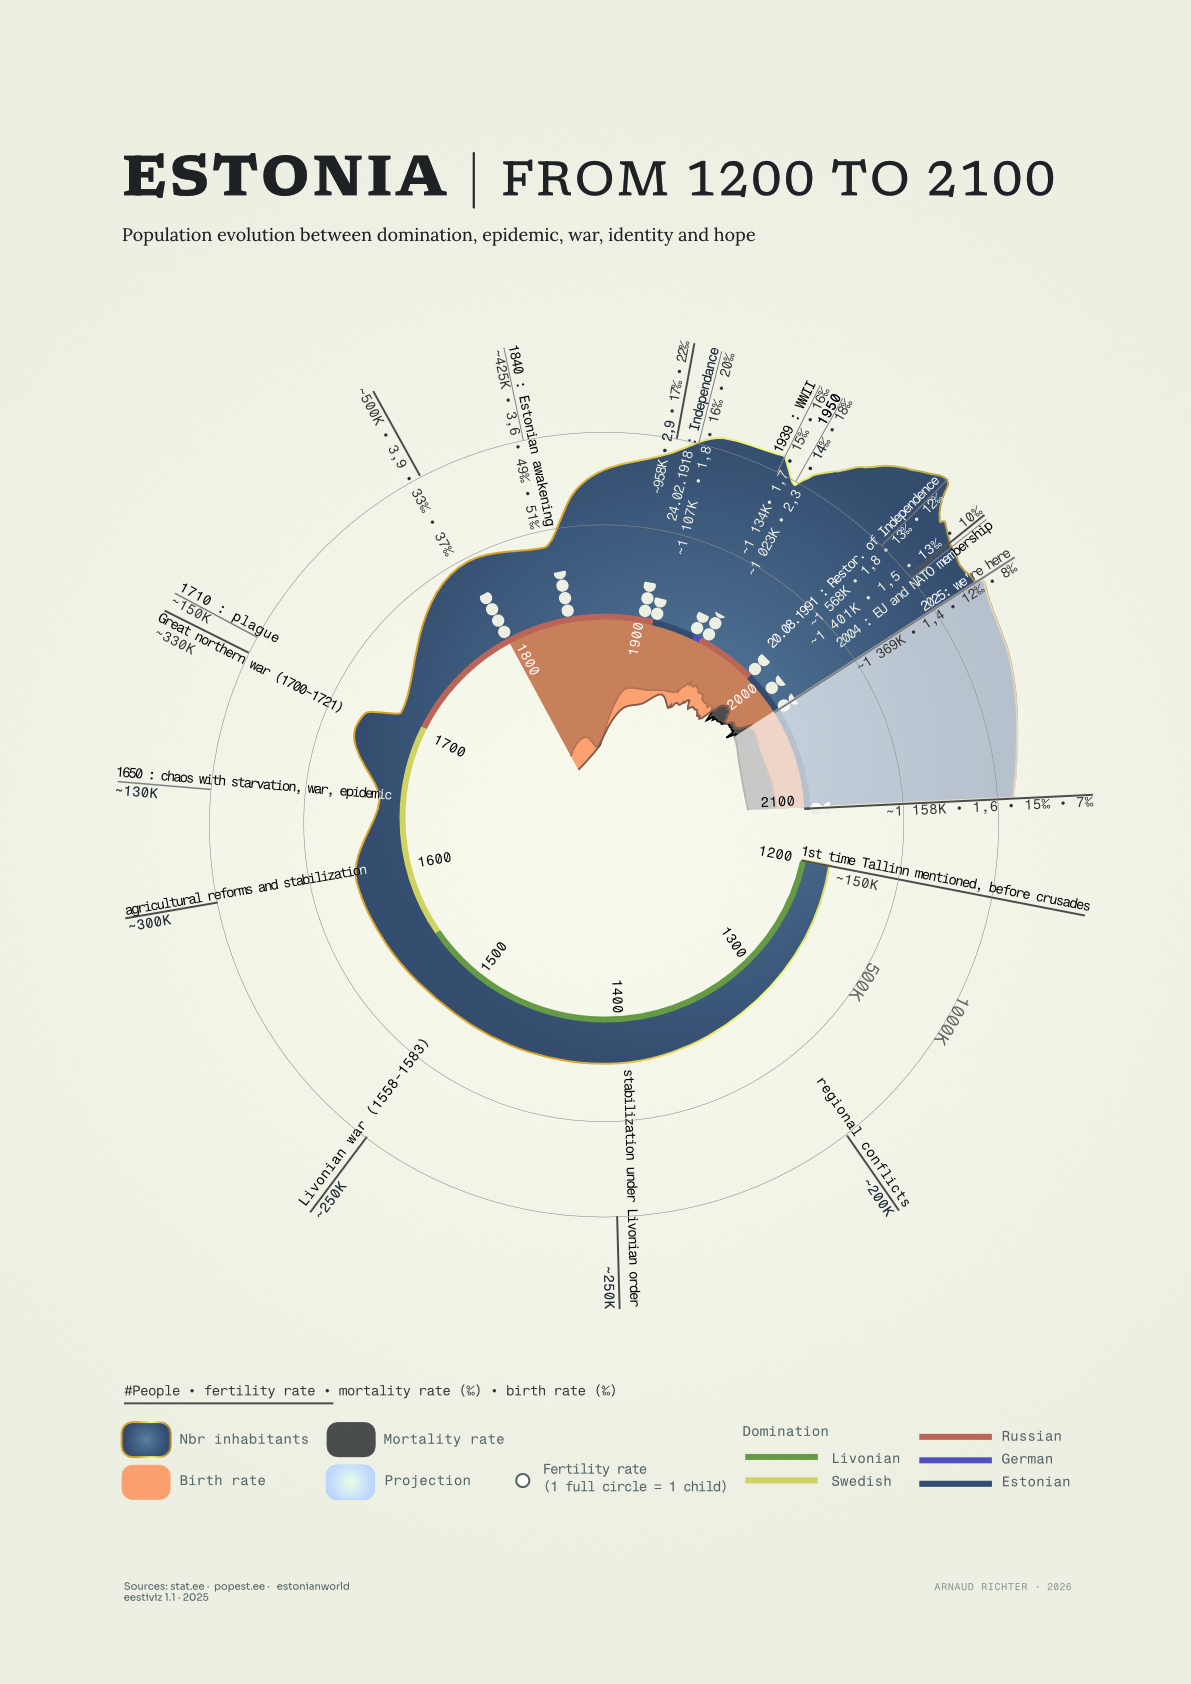
Written records place Estonia and Tallinn on the map as early as 1200 CE. At a moment when the country sat at the crossroads of Baltic trade routes. As a result, Estonia was in the path of every regional power that wanted to control it. This piece traces the population swings that followed: centuries of wars, invasions, famine and epidemics that kept growth flat for most of Estonia’s recorded history, followed by a shift toward sustained growth once things stabilised, sometime around 1800.
From 1800 onward, better records let the piece track birth, death and fertility rates alongside population size. Estonia’s trajectory mirrors the rest of Europe’s. Mortality and birth rates start high (around 33‰ and 38‰ in the early 1800s) then decline steadily as the population itself climbs. The Estonian national awakening of the 19th century, and the independence that followed in 1918, sit just before one of the country’s hardest stretches: occupation and war swelled the population through the Soviet period. The restoration of independence in 1991 triggered a sharp reversal. The population fell from 1.57 million in 1990 to 1.4 million by 1996. Estonia joined the EU and NATO in 2004, entering a period of stability that has held since.
Like much of Europe, falling fertility now means a shrinking population. A trend the piece follows through to current projections for 2100.
Full visualization: eestiviz_1-1 – population evolution
What ethnicities, religions and languages shape Estonia?
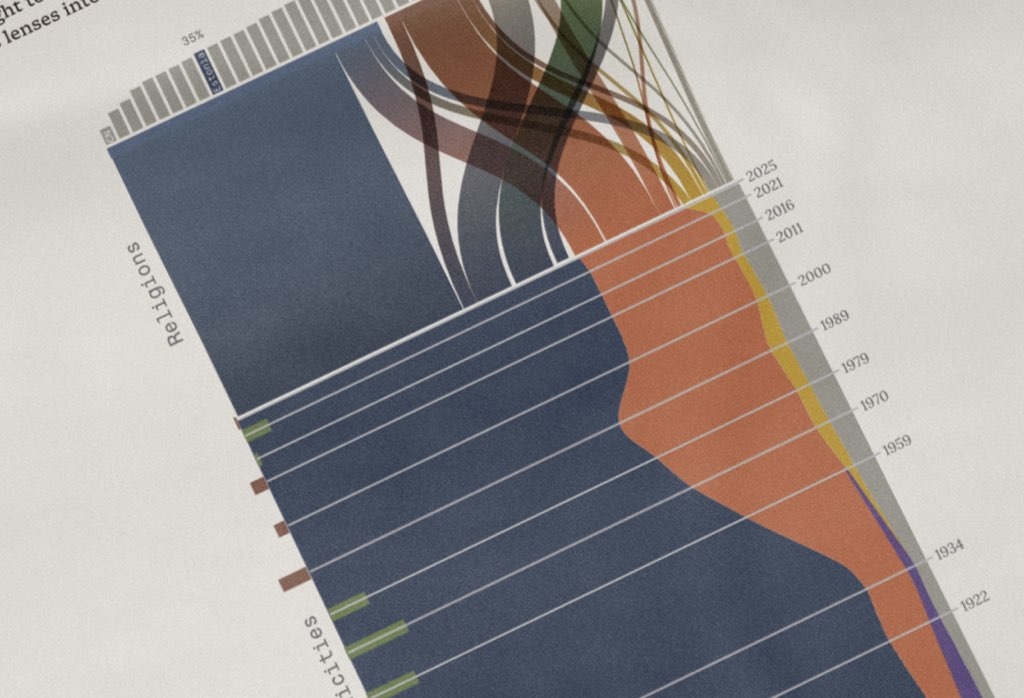
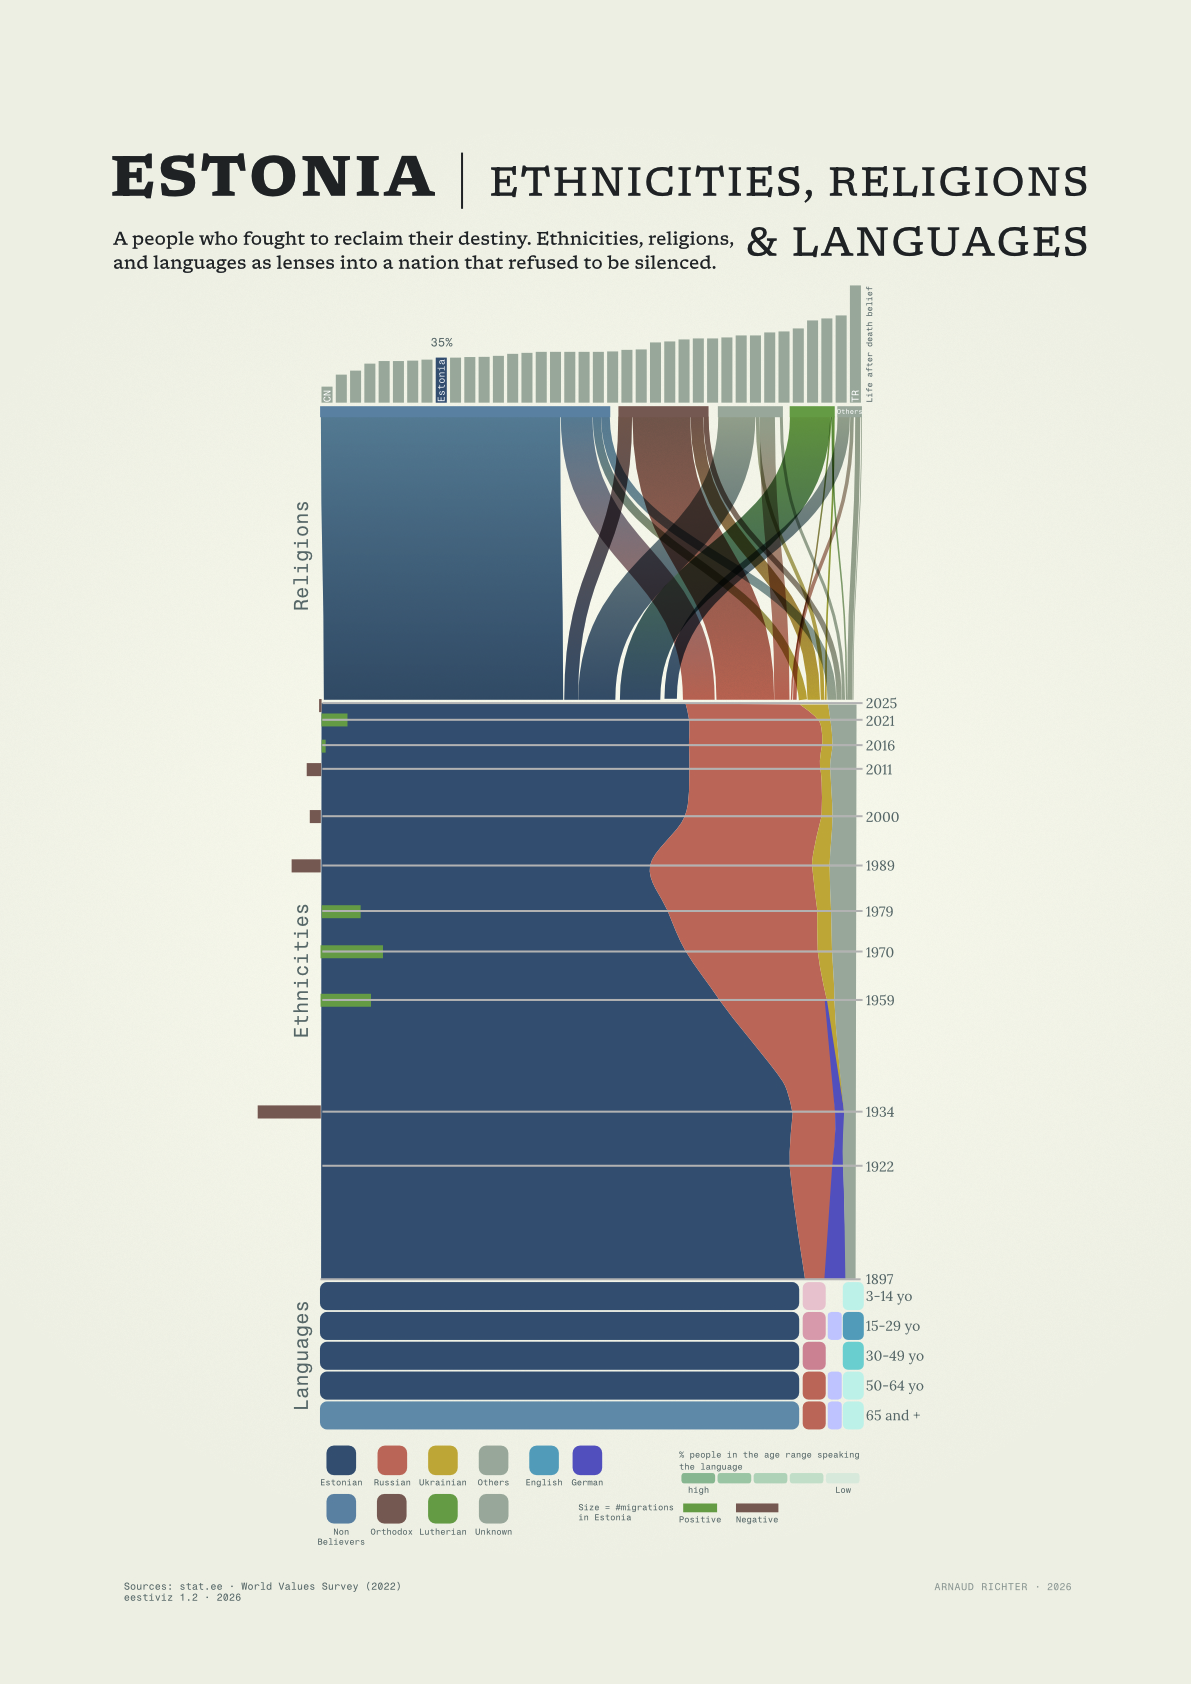
The second piece asks a different question. Who makes up Estonia, and how has that changed over time? Ethnic Estonians are the clear majority throughout the period the piece covers. But the Russian-speaking minority grew steadily under Soviet rule and peaked at 30% of the population just before the restoration of independence in 1991. Baltic Germans made up around 3.5% of the population through the late 1800s. Their legacy still shows up in Estonian vocabulary, architecture and even food before their share fell sharply through the 20th century. The Ukrainian population has been rising gradually since the 1950s. More steeply since Russia’s war on Ukraine escalated, and now stands at 5.4% of the population.
Religious beliefs
Estonia’s religious profile is unusual for Europe. The largest single group, by a wide margin, is people who identify with no religion at all (58.5% of the population). Neo-paganism ranks second, itself a distinctly Estonian result. A smaller share belongs to a Lutheran or Orthodox church. Orthodox believers are heavily concentrated among ethnic Russians living in Estonia, who make up 75% of that group. Consistent with all this, Estonia sits near the bottom of European rankings for belief in an afterlife, at 35.1%.
Languages across generations
Knowledge of languages splits cleanly by age. Younger Estonians are considerably more fluent in English than older generations, only 14% of whom speak English and older generations are, in turn, far more comfortable in Russian, at 85%. German follows the same generational pattern: a direct trace of the period when German carried the weight of education and culture in Estonia, before the national awakening shifted that status to Estonian itself.
Migration waves
Migration data is patchier than the rest, but the pattern is clear at key moments: a wave of emigration in the mid-1930s, ahead of the Second World War; large inbound waves during the Soviet occupation that followed; another wave of emigration around the 1991 restoration of independence, with smaller ones around the 2000 and 2011 censuses; and a fresh wave of arrivals tied to the war in Ukraine.
Full visualization: eestiviz_1-2 – ethnies religions and languages.jpg
Is Estonia a happy country?
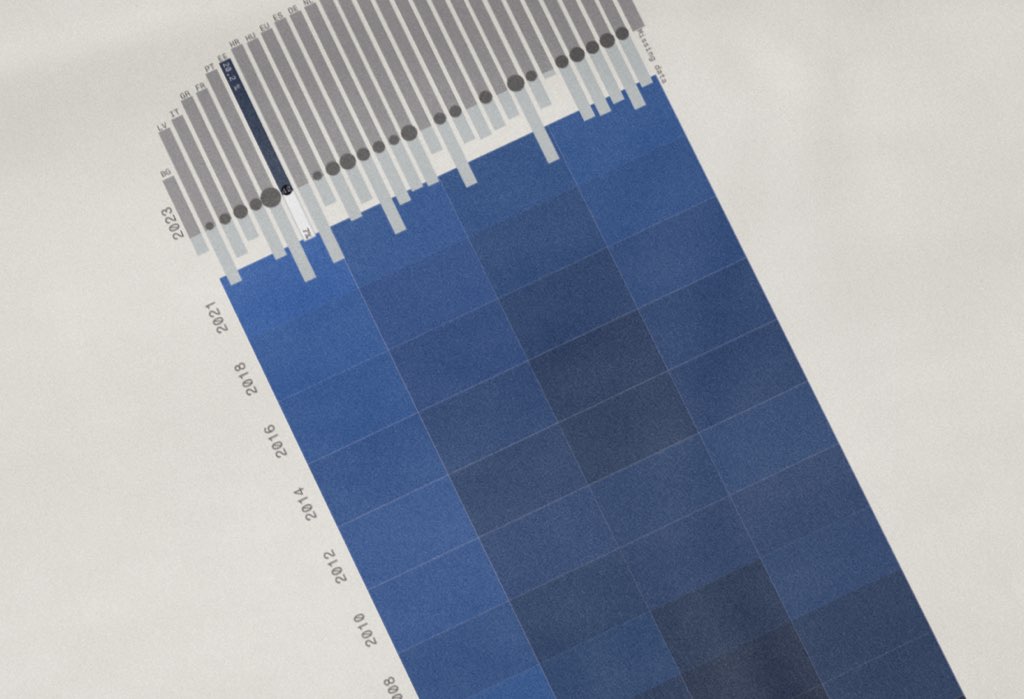
The third piece asks the most personal question of the series. Are Estonians satisfied with their lives? Estonia doesn’t rank near the top of European life-satisfaction tables, but the trend is moving in the right direction. What surprised me most while building this piece is that a relatively low share of self-reported happiness doesn’t come with unusually high rates of chronic depression or antidepressant use. The numbers don’t move together the way I expected.
The restoration of independence in 1991 triggered radical reforms, and their social and economic cost reached a breaking point in the mid-1990s: life satisfaction hit a low of 37.2% in 1996. It climbed steadily afterward, especially among younger Estonians. Even the oldest generation, which reports the lowest satisfaction of any age group, has seen some improvement. By 2021, 85% of the population reported being at least satisfied with life.
Full visualization: eestiviz_1-3 – happiness
How was the data collected?
All three pieces are built on data I gathered by hand. There’s no single dataset behind any of them. The population piece took the most work: sources in Estonian-language history books, cross-checked against each other, closer to historical research than data processing. Part of the job was knowing when to stop where the numbers weren’t reliable enough to visualize honestly. Sources are indicated on each visualization and it comes mainly from stat.ee
What does this data art change?
These three pieces gave me a way into a history that runs nothing like the French history I grew up with. You can see it clearest in the population piece : centuries under foreign rule, a national awakening, independence, a second occupation, and finally the return of self-determination. The ethnicity, religion and language data confirm the same story from a different angle: every foreign power that controlled Estonia left a visible trace in who lives there, what they believe, and which languages they carry into old age.
What’s next
This series marks my first real attempt to visualize a country I’ve spent twenty years returning to. Population is the entry point : its growth, its beliefs, its makeup, and how satisfied its people feel with their lives. I hope it gives you a way into Estonia, even if you’ve never been there yourself. I’m already working on the next series, on Estonian territory itself, and it has its own surprises.